And costly.
If you are getting a mobile app developed locally in a geography such as USA, for an iPhone app development, you may need to pay at-least $25,000 and as much as $37,000 as starting prices. Yes, outsourcing your mobile app to India will make it cheaper by 50% – 70% but there is still serious money to be spent.
Moreover , more than 99% of the mobile apps developed fail. Yes, we, as a mobile app development company are making this admission to you. Across the world, 99% of the apps (particularly the consumer facing ones) will FAIL.
Why is why before creating an app, a lot of background work should go into it. This is called as the ‘Discovery’ Phase in App development.
And in this discovery phase, it’d do you a lot of good to take a look at User trends, user statistics and user preferences of your typical mobile app user, before building an App for them.
Which brings us to the objective of this post:
Some insightful trends, statistics and insights about the users which you as Mobile app Development client or app developer should know.
1. Mobile Advertising Key Statistics for 2018 and beyond:
A) By 2019, mobile advertising is expected to represent 72% of all U.S. digital ad spending.
(Source: MarketingLand Report)
However: 70% of people report disliking mobile ads. (HubSpot) . In fact, mobile ad blocking has increased 90% year-over-year.
B) What Percentage of Online Traffic is from Mobile in 2018 ?
In 2018, 52.2% of all worldwide online traffic was generated through mobile phones, up from 50.3% in the previous year (Statista, 2018) . 57% of all U.S. online traffic now comes from smartphones and tablets (BrightEdge, 2017)
C) Mobile apps have much higher engagement rates than mobile-optimized websites or desktop web viewing, and 100-300% higher conversion rates (TechCrunch, 2018)
2. Mobile Usage Trends and Statistics for 2017 , 2018 and beyond (across the world)
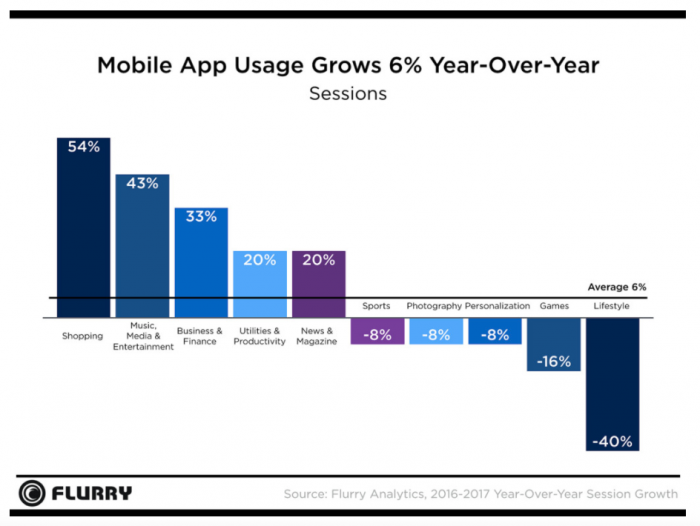
A) Global mobile data traffic is projected to increase nearly 3x between 2018-2021. (Statista, 2018)
B) 46% of smartphone owners say their device is something they “couldn’t live without.” (Pew Research, 2017)
C) The average US smartphone owner uses over 35 apps per month. The top 20% of app users use over 45 apps monthly. (App Annie, 2018)
D) LOL on this One ! Neuroscience researchers have discovered that today’s consumers find delayed mobile loading times more physiologically stressful than viewing a horror film. (Ericsson, 2018)
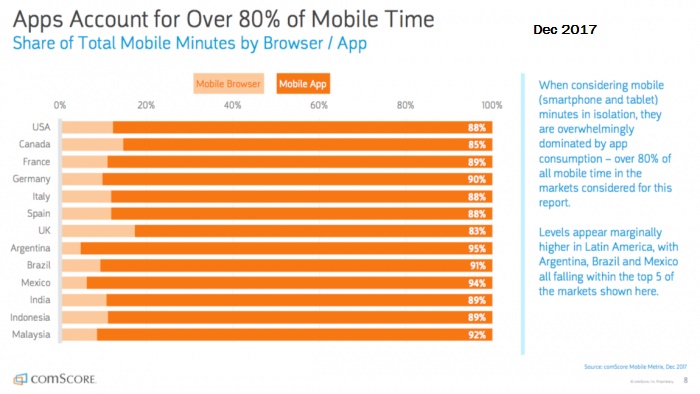
Usage Pattern by Mobile Time spent, Worldwide, Comscore Dec, 2017
F) Predictions: “50% of all searches will be voice searches by 2020” according to comscore
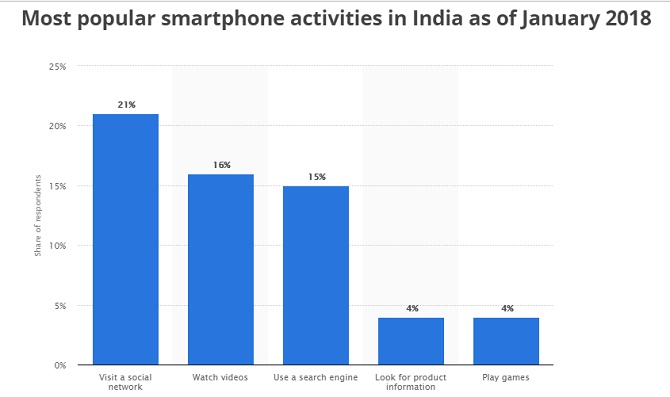
G) India has become the world’s fastest-growing market for mobile applications on both the Apple ioS and Google’s Android Play Store, with a sharp spike in revenue in the first quarter of 2018. (economictimes.com , 2018)
3. Key statistics regarding Mobile Search and Mobile Commerce.
A) Google drives 96% of mobile search traffic, followed by Yahoo at 2% and Bing at 1%.
(Source: NetMarketShare ) So if you want to increase your mobile search traffic, optimize for Google on smaller screen sizes. That means truncated titles, meta-descriptions, and careful consideration of Google AMP.
B) 69% of consumers worldwide between the ages of 18 and 39 use mobile devices to research products before they buy. Source: AUM Core [Oct, 2017 Stats]
C) Over 51% of smartphone users have discovered a new company or product while conducting a search on their smartphone. (Google, 2018) and 42% of all mobile brand experiences involve search (Google, 2017)
D) The top five preferences of mobile-first shoppers are: in-store pickup for purchases, free gifts with purchase, price matching, coupons, and customer service. (RetailDive, 2017)
E) 79% of keywords overall and 47% of keywords in positions 1-20 rank differently in search on mobile and desktop SERPs (BrightEdge, 2017)
F) 35% of the time the first page that ranks for a domain on a query is different on mobile and desktop SERPs (BrightEdge, 2017)
G) 53% of mobile website visits are abandoned if a mobile site takes longer than three seconds to load. For every one second delay in site load time, conversions fall by 12% (Google, 2018)
H) The average mobile webpage still takes 15.3 seconds to load (Google, 2018)
I) 88% of Smartphone Users Increased their Use of Mobile Coupons in the Past 3 Years. (Adcolony)
J) Over half of e-commerce app users (54%) would use augmented reality features on their app. (Clutch E-Commerce App Survey)
4. Key Statistics related to younger generation and millennial’s Mobile Usage Habits
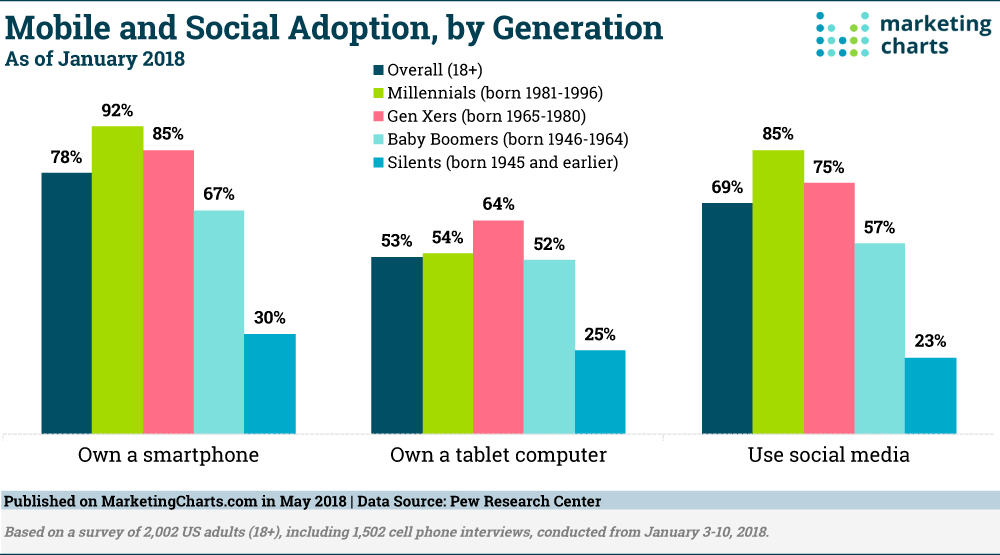
Mobile and Social Adoption by Age , Date: Pew Research, published on MarketingCharts.com
A) Millennials touch their smartphones 45 times a day
B) Smartphones are dominant devices across the entire population. 87% of both millennials and non-millennials own a smartphone (Fluentco, 2017)
C) 15% of millennial smartphone owners make online purchases on their smartphones multiple times per week, plus another 15% make smartphone purchases weekly (GlobeNewswire, 2017)
D) Apple products, particularly the iPhone, are disproportionately popular with millennials (Fluentco, 2017)
5. Key statistics on Social Media Apps Usage and Trends in 2018 on Mobile
5.1 The Manifest conducted a survey of 511 smartphone owners who use at least three apps daily. Our first report on the survey focused on social media apps. Some key Findings:
A) Social media apps dominate the most frequently used apps (39%), while gaming and communication/messaging apps tie for second (10%).
B) The largest percentage of respondents (32%) say they open any kind of app on their phone only 1-10 times per day total, but they are likely underreporting their behavior.
C) Over half of respondents (51%) deleted an app only 1 week ago or less.
A full quarter of respondents (25%) say they deleted an app simply because their phone’s storage space was full and they needed space.
5.2 What is Facebook’s Mobile vs. Desktop Usage in 2018 ? And what about other Social media Apps ?
A) In 2017, 95.1 percent of active Facebook user accounts accessed the social network via a mobile device (Statista, 2018)
B) As of 2016, 80% of its users access Pinterest through a mobile device (Pinterest)
– 85% of the time users spend on Twitter is on a mobile device (Wall Street Journal)
– 60% of LinkedIn traffic comes from mobile devices (Fortune, 2017)
6. Key statistics regarding Email, Notifications and SMS usage on Mobile
A) By 2018, 8 in 10 email users will likely access their email accounts exclusively from their mobile devices (emailmonday)
B) Welcome emails sent to newly acquired users have the highest open rates at nearly 60%. (Experian)
C) Adding emojis to push notifications results in 70% higher CTRs. (CleverTap 2018)
D) Personalized push notifications see 9.06% higher open rates than generic messaging. (CleverTap, 2018)
7. Some Key Statistics regarding Gaming and Video Usage on Mobile
A) It is estimated that by the end of 2017 there will have been 2.1 billion mobile gamers worldwide, and this number is expected to further grow to 2.7 billion by 2021. (Statista.com , 2017)
B) By 2020, mobile gaming (which includes tablets) is expected to account for over half (51%) of the entire gaming market. Comparably, console games and boxed/downloaded PC games are expected to make up the second and third largest portions of the market, generating 26% and 21% of all digital gaming revenue respectively (Newzoo).
C) Surprise Insight: Though one might expect teens to make up the largest subset of mobile gamers, mobile gaming use is dominated by two demographics: females and consumers aged 65 and older. oday, 63% of mobile gamers are female and 37% are male (Tapjoy). Additionally, of the females who play mobile games 60% play a mobile game everyday. Comparably, only 47% of male mobile gamers play a mobile game every day (eMarketer)
8. Key figures and statistics about Consumer Satisfaction and Consumer Behavior on Mobile Phone in 2018
A) 57% of users say they won’t recommend a business with a poorly designed mobile site (socPub)
B) 80% of smartphone users are more likely to purchase from companies with mobile sites or apps that help them easily answer their questions. (Google, 2018)
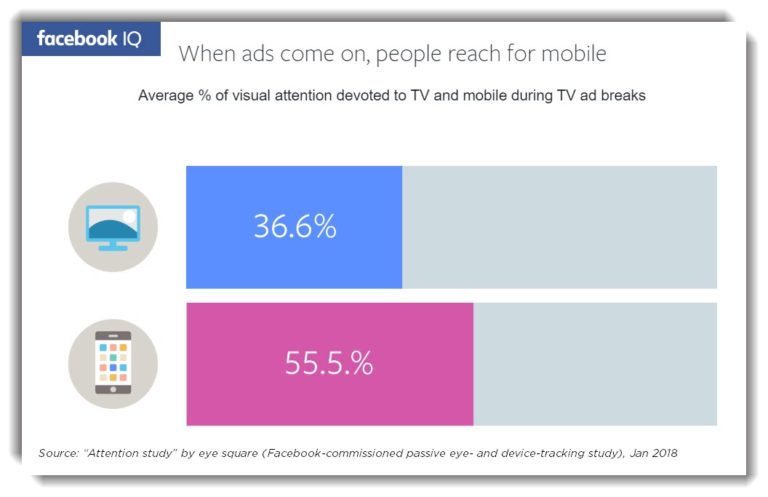
C) During TV shows, viewers paid attention to mobile 28% of the time, and during TV ads, they paid attention to mobile more than half the time. People ages 18–24 looked at their smartphones 60% of the time during TV ads, and people ages 45 and over did so 41% of the time (Facebook, 2018)
D) Interesting Insight: Watch time of “does it work” videos grew by more than 11X in the past two years as consumers seek out visual proof that the items they’re considering are worth it (Google, 2017)
E) Organizations are experiencing as high as 3x ROI for personalization efforts. (Monetate, 2017)
F) 23% of consumers claim in-app recommendations would prompt them to add more products to their shopping carts, and 33% say it would get them to spend more time in the app. (comScore, 2017)
9. Trends of Mobile App Development Budget and Business Sentiment for Mobile Apps in 2018
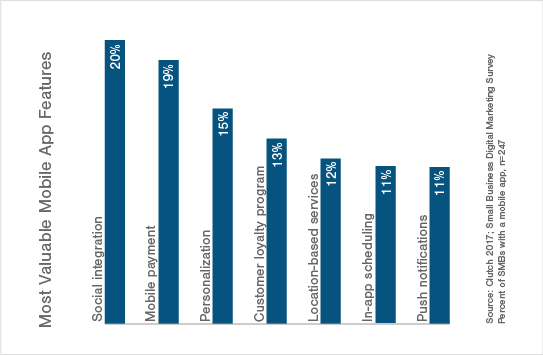
A) 32% of senior mobile experts say “creating personalized customer experiences” is the greatest long-term growth potential for mobile products. (Incite Group)
B) Despite 68 percent of organizations expecting to increase spending for mobile apps, the average proportion of the overall software budget is only 11 percent. (Gartner worldwide Survey Results in Sydney, June 2017)
C) Cloud application will account for 90% of mobile data traffic by 2019 (Cisco)
D) Two-thirds of small businesses (67%) planned to have a mobile app built by the end of 2017. (Small Business Mobile Apps 2017)
E) Small businesses that planned to build an app in 2017 were primarily motivated to improve customer service (36%). (Small Business Mobile Apps 2017)
F) App development companies most commonly built iOS native (75%) and Android native (61%) apps. (App Development Cost Survey 2017)
10.Some Key Mobile Development New Technology & Mobile Security Statistics and Trends from 2017 and 2018
A) 61% of mobile users say it’s extremely important to them that a company deletes personal data when they ask it to. 70% of these also say they’re concerned personal information will be shared without their permission. (Mobile Ecosystem Forum, 2017)
B) 94% of IT professionals expect mobile security attacks to become more frequent. (Mobile Business Insights, 2017)
C) According to data corporation (IDC), the revenue growth of AI market will amount to an approximate 47 billion dollars in 2020.
D) Mobile augmented reality is expected to become the primary driver of a $108 billion VR/AR market by 2021. (TechCrunch, 2017)
E) Location-targeted mobile ad spend will grow from $12.4 billion in 2016 to $32.4 billion in 2021. (BIA/Kelsey, 2017)
These are some great statistics and highlights , trends related to mobile app Usage and consumer behavior spanning 2017 and 2018. We will be updating this further in 2019 so stay tuned. And feel free to quote these or use these in your articles or presentations – just crediting the article.
Looking for a Mobile App Development Company in India, Delhi ? Contact us for a quote for your project today.

